We are currently working to put together the data and intelligence strategy for London Plus. A large part of this strategy will be to develop original research on the state of the civil society sector in London.
As a first step we have been using data from the Community Life Survey to explore how many people have been involved in civil society in London over time. The Community Life Survey is a questionnaire sent out to people across England, with participants chosen to be representative of the population as a whole.
Volunteering
People were asked whether they had given unpaid help to anyone who is not a relative, either informally, or formally through a voluntary agency. This could include offering help directly to an individual, or involvement with groups and events.
We’ve included informal volunteering in this analysis to acknowledge the range of social action people are engaged in across London, of which formal volunteering is just one route. The survey, however, includes questions about whether volunteering was formal or informal.

Rates of volunteering were similar across London and the rest of the country. The majority of Londoners do give up their time to help others, with 63% of people volunteering in the last 12 months in the year 2016-17. This has also remained relatively steady over the years, with a small decrease in volunteering in London in the year 2015-16.

Hours spent volunteering were also similar inside and outside London. For those who did engage in volunteering in the last four weeks, people spent an average of 10 hours on formal volunteering and 7 hours on informal volunteering. Time spent volunteering ranged from 1 hour a month, up to 250 hours in a month [1].
[1] This chart combines responses from 2013-2017 to calculate averages. Hours spent volunteering across these time periods were relatively stable.Civic participation
People were also asked about their civic participation. This was defined as the extent that they are involved in local affairs, including online participation and community decision making through formal roles or groups.
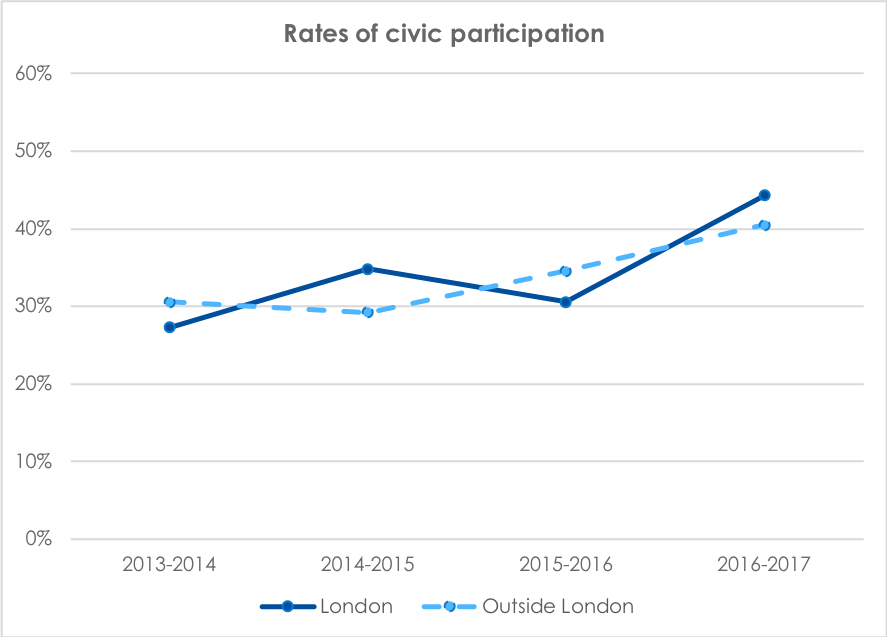
As with volunteering, rates of civic participation were similar both within and outside of London. A rising proportion of people have been involved in civic participation from 2013-2017, with 44% of Londoners reporting some involvement in the last 12 months in the most recent survey. Regular involvement was much less common, with just 6% of Londoners reporting civic participation in the last four weeks.
Next steps
We have a number of questions remaining about civil society in London that we are aiming to explore in our research programme. These include:
- Who is involved in civic participation and volunteering in London, and do they represent the diversity of London as a whole?
- What areas of work are they involved in, and how far does this complement the needs of local areas?
- What are the drivers (and barriers) to engagement?
- How can we demonstrate the positive impacts of civil society on Londoners’ lives?
If you have any questions, recommendations for research we could be doing, or for how best to use data and intelligence to support civil society in London, please email us at natasha@londonplus.org
Data note: The community life survey includes just under 4,000 people living in London over the four survey years. Survey weights are used to maintain representativeness of the sample.